TDD Hat
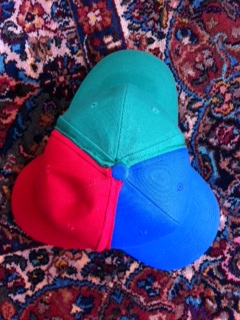 I’ve achieved some notoriety with my Test Driven Development hat. Not so much when I wear it
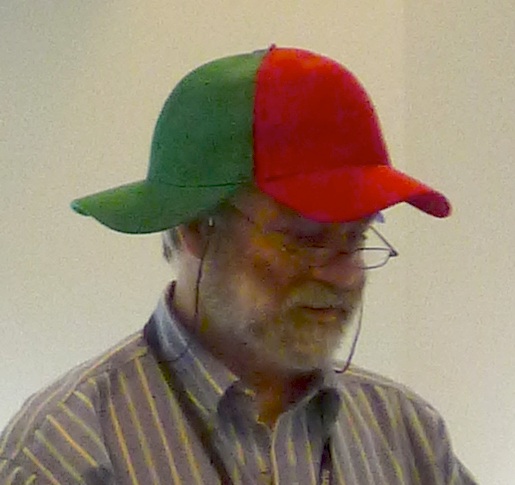 , but certainly when Uncle Bob does. So much so that he has received queries about acquiring or making them. Read More
I’ve achieved some notoriety with my Test Driven Development hat. Not so much when I wear it, but certainly when Uncle Bob does. So much so that he has received queries about acquiring or making them. Read More
I’ve talked about the rush to standardization before. This article offers a more detailed look at the problem, and offers an alternative.
In my experience, Agile projects almost never have a single milestone at the end. The business wants to see multiple milestones along the way, taking internal releases from the development team even if they’re not prepared to make them public. The simplest dashboard I know to illustrate this situation is a burnup chart with multiple goal lines, indicating the goals of each milestone.
This sort of chart is trivial to create by hand or with a spreadsheet. The typical Agile Project Management software, while providing a myriad of ways to view data, never seems to include something as simple and powerful as this. Fortunately, it doesn’t take much time to create your own. It takes a few minutes at the end of each sprint to update the chart, and you can make sure that the data is correct as you do so.