What is the Right Length for a Project?
I’ve seen many comments on the topic of estimation in the past year, and I’m starting to notice some trends and assumptions in them. One of the common assumptions is that, given a particular team and amount of resources, there is a correct length to a project. A twin to this one is that there is a correct estimate that contains the same end date as the subsequent actual project performance.
I realize that a lot of the dysfunctions in the practice of making and using estimates derives from these assumptions. I’m not surprised that there is a class of middle managers who have been promoted to management positions without management training or mentoring who hold such beliefs. I am somewhat surprised when people who are lobbying to drop the practice of estimation also espouse the same beliefs.
As I think about any project in which I’ve participated in the development, I can think of alternative ways the work could have been organized. Perhaps the work of different individuals or team could have been integrated earlier and more fully. Perhaps the work could have been done in a different order. Perhaps unknowns about the technology or solution could have been discovered before significant work had been built on incorrect assumptions. Perhaps simple human mistakes could have been discovered earlier, or, if different people had been involved in the erroneous task, avoided altogether.
It’s easy to spot such alternatives in hindsight. With forethought, it’s fairly easy to recognize that such alternatives exist. It is impossible, though, to predict what set of alternatives will result in the shortest schedule or the best outcomes measured in other ways. There is no perfect way to run a project. There is no equation or formula that can ensure peak performance. It remains an art, and success is enhanced by knowledge and wise heuristics. I suspect there is also a component of luck.
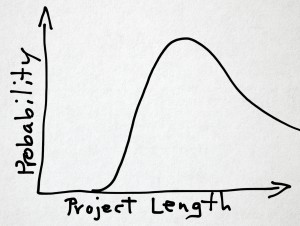
Once we let go of the concept that there is a “right length” for a project, we’re left with a probability distribution. If we were to do the same project, or similar projects, many times, with similar teams, or the same team, what would be the distribution of lengths?
This would be an incredibly expensive experiment to run, of course. It would have many difficulties in determining what is a similar-enough project and similar-enough team. If using the same team, there would be an accumulation of learning that would likely affect the results toward shorter lengths of time. Would this be valid data? What, exactly, is done? Even when the feature list is fixed, there’s always some leeway in the details of those features—even more so when working in close collaboration with the business stakeholders who want the project output.

While the experiment is impractical, thinking about it is both practical and enriching.
A team that has worked well together, especially on similar projects, is likely to achieve a shorter times. Teams that gel during the project would likely get it done faster than teams that don’t gel. Teams that have less experience in the technology will likely take longer than teams with more experience, due to the time consumed by the learning curve. Teams that make more errors will take longer than teams that make fewer. Of course, this is a lop-sided distribution since there is infinite room for making errors and avoiding errors is limited to zero. I would guess the probability distribution might look something like this.
If it does, what is the correct length for this project?
Interesting questions, George. Making the probability distribution even more varied is the learning not only of the team in terms of skill and domain familiarity but of the software and its value. And this would be contextual in time and market conditions, among other things.
Don Reinertsen would maybe say “The length which maximizes economic gain.” I might say something similar. Then again, that might be foolish.
George, What I’m hearing from the gurus of Monte-Carlo simulations of projects who looked at many data sets from real-world software and IT projects (you’ll probably meet them next week at Agile2013) – the distribution is Weibull. When the Weibull shape parameter is in a certain range, the distribution curve looks just like you drew it.